Turkey’s Monetary Policy from a Comparative Macroeconomic Data Perspective
Usually, in LongViewTurkey we tend to avoid writing on regular data releases unless they have a long-lasting impact on the economy. MPC decisions by the Central Bank of Turkey is also something that we do not write on a regular basis, because we have been observing that lately discussing CBT’s policies has diminishing returns: Harder one tries to understands and analyzes CBT decisions, the more it confuses both himself and the reader.
Yet, the MPC decision on January 21st was one of a kind that even this economist does not want to avoid writing about; but it will be done in LongView style: In comparison to other EMs and with its impact on longer-term macroeconomic indicators.
First, What Was the Decision?
MPC meeting in Turkey on January 21st was critical in many respects. After TL’s recent slide, many analysts were wondering whether the CBT would signal a return to orthodoxy by rising the interest rates or whether it would stick to last 4 year’s policies by keeping the interest rates constant.
Depending on where you stand, it did both or it did neither: It kept the interest rates on the interest rate corridor constant but it declared that on certain days it could raise the funding rates as high as 9% (from current 7.75%) by playing with the liquidity at the BIST market.
Why Is it Different Than the Previous Decisions?
The unorthodoxy of CBT policies is that they has been aiming multi targets and CBT has been letting the interest rates fluctuate within a band within a corridor, differentiating between policy rate and average funding rate. But this time around, CBT says it might increase the average funding rates as high as 9% without officially increasing the upper end of the corridor (7.75%).
Many analysts commented that this is a de-facto rate-hike on the upper end of the corridor; but it is one with a great uncertainty attached because we don’t know by how much CBT will rise the rates. At a time when TL is under pressure, this uncertainty was not welcomed by the markets and the currency weakened further following the MPC decision, despite CBT’s direct intervention to the market on January 23rd.
What Was the Unorthodoxy for in the First Place?
CBT’s monetary polices got complicated starting with 2010 when it announced that it would target financial stability as well as price stability. While the interest rates were kept low, interest rate corridor was introduced later in 2011 to ‘give CBT flexibility to act swiftly’. It also created a band of uncertainty around TL-assets. In addition to tools to prevent TL from over-appreciating, CBT used macro-prudential policies to control domestic demand, especially pressures coming the credit market side. Credit growth caps were also introduced. The targeted net impact of lower interest rates and active use of macro-prudential tools was initially tightening, at least until the first half of 2013.
What Was the Impact?
Objective here is to find out where Turkey stands in terms of main indicators, given the Central’s Bank’s objectives. The impact analyses here will be done in comparison with 10 emerging markets (usually in LongViewTurkey, we look at 15 markets; but for this article for the sake of obtaining our data from one source, data is limited to 10 markets). Data is from OECD’s Main Economic Indicators and it is between 2011 and 2013.
Here are some observations from the comparative data:
- Turkey has the fourth highest GDP growth rate during the mentioned period, after Indonesia, Chile and South Africa
- Government consumption growth has also been one of the highest during this period.
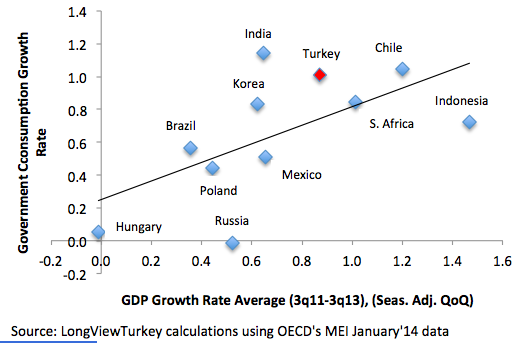
Turkey has a bad growth mix
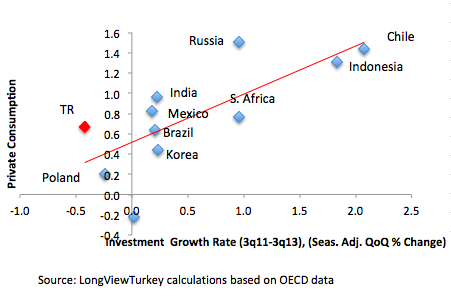
• In terms of private consumption growth, Turkey’s average growth performance is close to the average of the 10 countries in the exercise
• Yet, in terms of investment, Turkey is the worst performer with its investment growth rate standing at -0.4%
• Apart from Turkey, Poland also has a negative investment rate; but in Poland’s case, private consumption growth rate is also below average
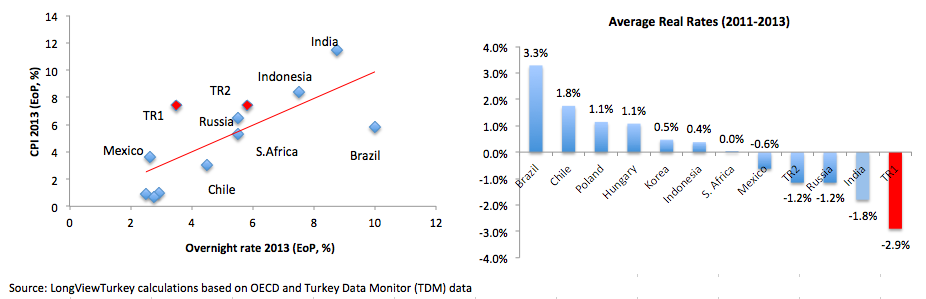
On a Comparative Scale, Rates in Turkey Are Lower than Implied By Its Inflation Rate
• Turkey has the second highest CPI inflation after India during 2011-2013 period and the third highest by the end of 2013.
• As the recent MPC decision revealed once more, it is hard to pinpoint Turkey’s policy rate as the CBT does not use a single facility to fund the markets. The below graph shows the ON rates, which corresponds to the lower end of Turkey’s interest rate corridor (TR1); but we also used TR2 to show Turkey’s position calculated with average funding rate (average interest rate of all liquidity providing tools). In any case, interest rates in Turkey are lower than implied by its inflation level, compared to other countries.
• By the same token, real interest rate in Turkey is one of the lowest within these countries.
TL, Rand and Real Depreciated the Most
• In line with negative real rates and also in line with the initial objective of CBT, TL was one of the highest depreciating currencies (after South Africa and Brazil)
• In line with its depreciation rate, export volume growth was one of the highest
• There is not an even performance in countries’ export/import performance ratio. Still, Turkey’s is one of the better export performing countries compared to growth of its imports (countries above the trend line)
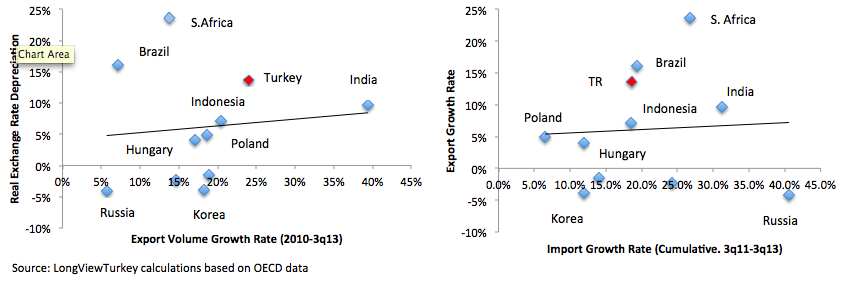
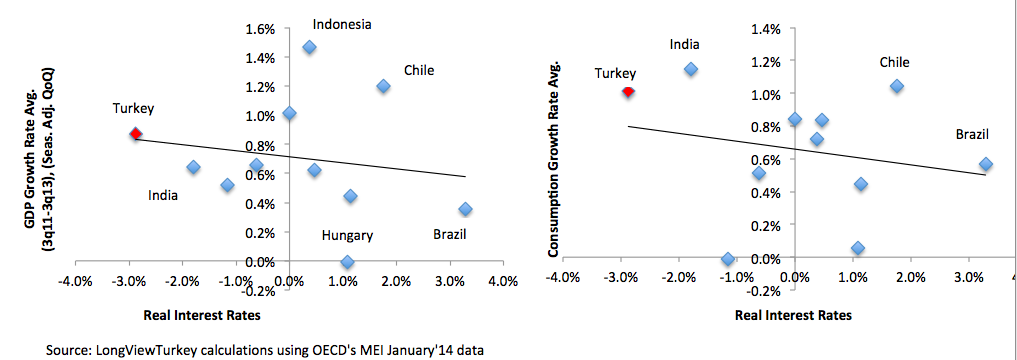
• Looking at the trend lines, real interest rates are negatively correlated GDP growth rate, consumption and import growth rate in these countries; but real rates and investment graph is inconclusive.
• Given Turkey’s non-favorable growth mix relative to other countries, impact of lower interest rates on different components of growth becomes a concern.
Summary so far
Turkey has/is:
• The worst investment growth performance
• Mediocre consumption growth performance
• Outlier in terms of level of consumption to investment
• Inflation that remains above EM average
• Policy rates (whichever you take) that remain below implied by the inflation rate
• Hence, one of the lowest real rates
• One of the highest depreciating currencies
• One of the highest export volume growth
• Also the worst current account performance
In all of the above graphs, Turkey is an outlier compared to the trend line or it stands at the far end of the trend line.
Results:
In comparison to other EM countries, Turkey has interest rates much lower than implied by its inflation rate. Lower real rates induce import growth, consumption and overall GDP growth rate; but it also seems to spoil the growth mix. Lower real rates (or the uncertainty created by the interest rate corridor), on the other hand seem to have initiated depreciation of the currency, carrying exports volume higher. Yet, the same combination does not help with the current account deficit.
Recent MPC decision, which in summary is ‘more of the same unorthodox policies’, should be evaluated along the same lines: With inflation above target, growth mix unfavorable, current account remaining high, how has the unorthodoxy of monetary policies helped Turkish economy? And with the results at hand, if you think that the currency has overshot, what is the point of keeping interest rates low (or keeping uncertainty band created by the interest rate corridor high)? My answer to these questions is that looking at the comparative graphs, the end results so far do not justify the means of CBT. More of the same kind of unorthodoxy does not look sufficient to change the course Turkish economy is in right now.